



INDIA CSR RESEARCH REPORT
A data-led assessment of the changing FCRA landscape. Active registrations have halved since 2015, while annual foreign contributions have risen to Rs.22,974 crore.
India’s foreign-contribution landscape has become smaller in institutional count but larger in financial volume. Active FCRA-registered associations declined from 29,022 in 2015 to 14,466 in 2026, a fall of 50.2%. Over a broadly comparable period, annual foreign contributions rose from Rs.17,832 crore in 2015-16 to Rs.22,974 crore in 2024-25, an increase of Rs.5,142 crore or 28.8%.

The result is a more concentrated operating environment. Delhi received the largest reported state or Union territory inflow at Rs.5,834 crore, while the United States supplied Rs.12,113 crore, equal to 52.7% of reported inflows. At the same time, Rs.35,968 crore remained unutilised, of which Rs.21,140 crore was held in fixed deposits.
The central policy question is therefore no longer only how much foreign funding enters India. It is also how widely it is distributed, how quickly it is converted into programme outcomes, and whether regulation produces both accountability and predictable operating conditions for compliant organisations.
Key Indicators
| Indicator | Reported figure |
| Active FCRA associations | 14,466 |
| Foreign contribution in 2024-25 | Rs.22,974 crore |
| Reported unutilised funds | Rs.35,968 crore |
| Decline in active registrations | 50.2% |
| Growth in annual inflow | 28.8% |
| Registrations cancelled | 21,983 |
Scope Note
Funding figures reflect the September 2026 parliamentary briefing described in the supplied news material. The attached MHA Annual Report 2024-25 supports the governing framework, application-disposal statistics and notified compliance changes. It does not reproduce the later JPC funding tables.
Contents
Executive Summary
1. National Funding Trend
2. Geography of Foreign Funding
3. Source Countries and Funding Concentration
4. Utilisation and Funds Awaiting Deployment
5. Recipient Distribution and Compliance
6. Regulatory Framework
7. Recent Changes and Strategic Priorities
Methodology Limitations and Sources
1. National Funding Trend
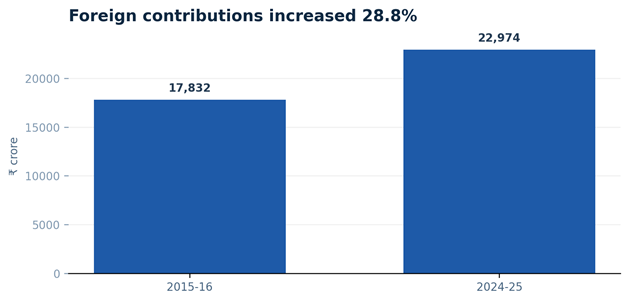
Figure 1. Foreign contribution increased from Rs.17,832 crore to Rs.22,974 crore
Annual foreign contributions increased by Rs.5,142 crore between 2015-16 and 2024-25. The 28.8% nominal rise occurred even as the number of active registered associations contracted sharply.
| Indicator | Earlier period | Latest period | Change |
| Active FCRA associations | 29,022 in 2015 | 14,466 in 2026 | Down 14,556 or 50.2% |
| Foreign contribution | Rs.17,832 cr in 2015-16 | Rs.22,974 cr in 2024-25 | Up Rs.5,142 cr or 28.8% |
Interpretation
The combined trend points towards consolidation: a smaller population of registered entities is handling a larger annual pool of foreign funding. This does not establish greater concentration at the organisation level because complete recipient-level distribution data is not available. It does justify closer examination of scale, geographic reach, governance capacity and the accessibility of foreign philanthropy to smaller organisations.
Average-Based Caution
Dividing total inflow by the number of active associations would produce only a crude average, not an actual typical receipt. Many registered organisations may receive no contribution in a given year, and the disclosed funding bands show large differences between recipients. Median and organisation-level data would be needed for a reliable distributional measure.
2. Geography of Foreign Funding
Delhi received the highest reported inflow at Rs.5,834 crore, followed by Karnataka, Maharashtra and Tamil Nadu. Together, these four jurisdictions accounted for Rs.13,696 crore, or 59.6% of the national total.
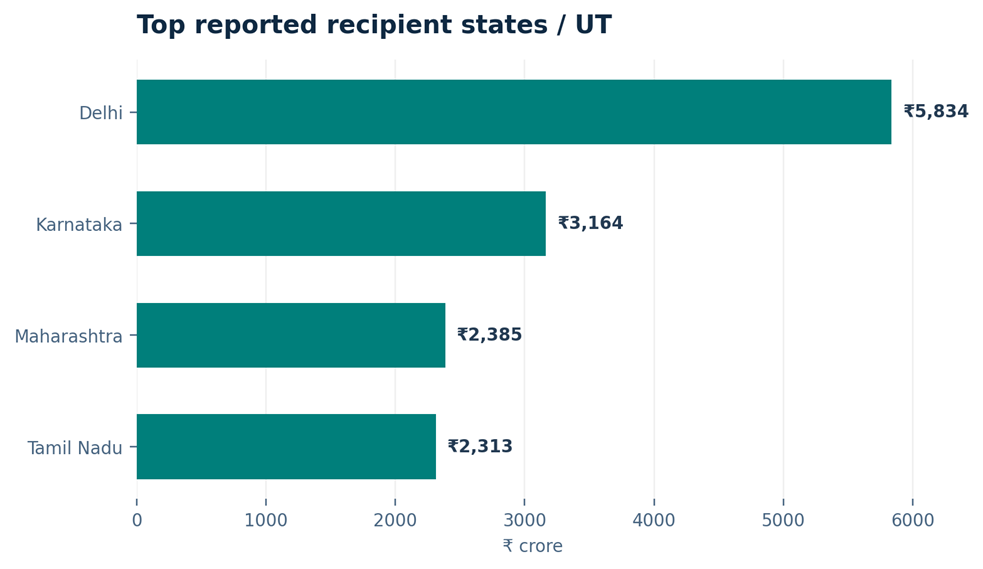
Figure 2: Top reported recipient states and Union territory
| State or UT | Active associations | Foreign contribution | National share |
| Delhi | 1,218 | Rs.5,834 cr | 25.4% |
| Karnataka | 1,355 | Rs.3,164 cr | 13.8% |
| Maharashtra | 1,578 | Rs.2,385 cr | 10.4% |
| Tamil Nadu | 2,102 | Rs.2,313 cr | 10.1% |
| Andhra Pradesh | 1,022 | Not specified | Not available |
| Kerala | 1,013 | Not specified | Not available |
Tamil Nadu had the largest reported number of active associations, while Delhi led on funding. The two measures should not be conflated: registration count reflects institutional presence, whereas inflow reflects the value received in a particular year.
3. Source Countries and Funding Concentration
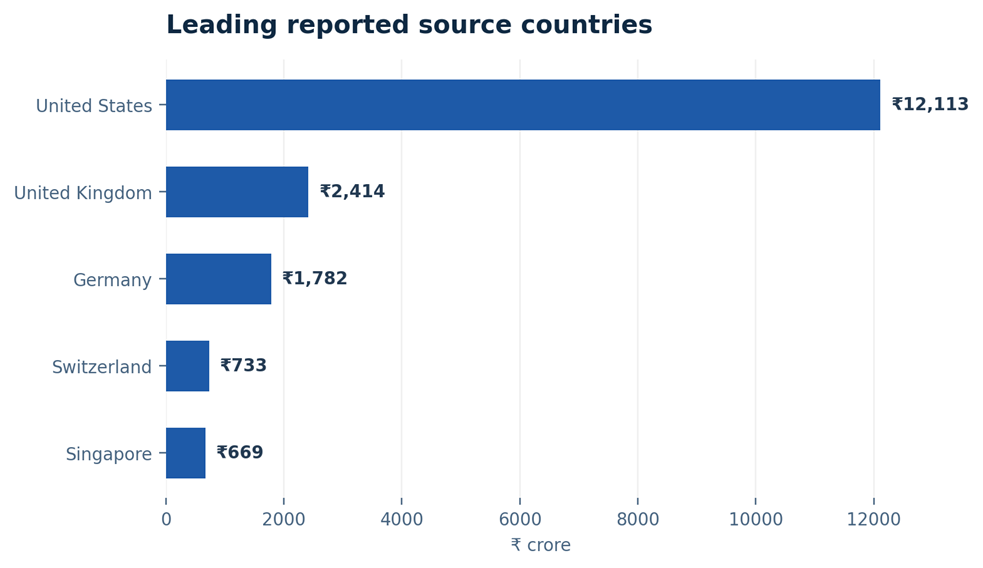
Figure 3. Leading reported source countries
| Source country | Contribution | Share of total |
| United States | Rs.12,113 cr | 52.7% |
| United Kingdom | Rs.2,414 cr | 10.5% |
| Germany | Rs.1,782 cr | 7.8% |
| Switzerland | Rs.733 cr | 3.2% |
| Singapore | Rs.669 cr | 2.9% |
| Top five combined | Rs.17,711 cr | 77.1% |
The United States alone accounted for more than half of the reported national inflow. The top five source countries contributed 77.1%, showing a high degree of origin-country concentration. Changes in donor strategy, currency conditions or compliance expectations in a small number of countries can therefore influence a large share of India’s foreign-funded social programmes.
Recipient organisations should consider donor diversification, adequate unrestricted reserves, programme continuity planning and realistic exit arrangements. Policymakers should maintain strong transparency requirements while providing predictable operating conditions for legitimate long-term partnerships.
4. Utilisation and Funds Awaiting Deployment
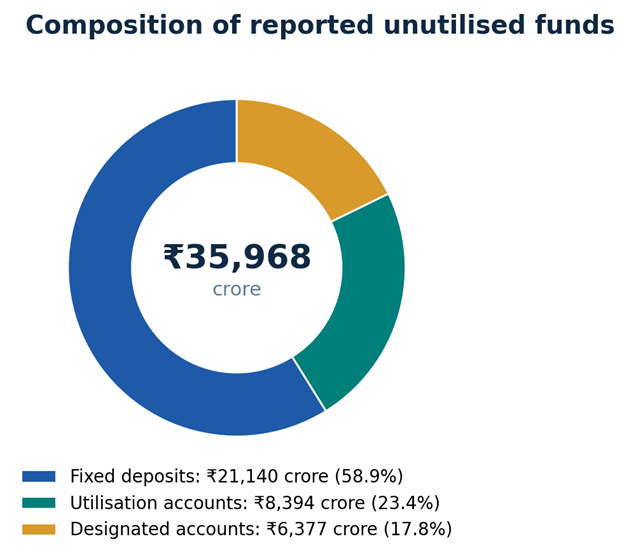
Figure 4. Composition of reported unutilised foreign contribution
Reported unutilised foreign contributions stood at Rs.35,968 crore. Fixed deposits accounted for 58.8% of this balance, utilisation accounts for 23.3%, and designated accounts for 17.7%. The three disclosed components total Rs.35,911 crore, leaving a Rs.57 crore difference from the reported aggregate, possibly because of rounding, classification or reporting detail not contained in the supplied brief.
The unutilised balance was equivalent to 156.6% of the foreign contribution received during 2024-25. This does not mean the entire balance should have been spent within the year. It may include multi-year grants, restricted funds, timing differences and commitments for continuing projects. It nevertheless highlights the need for clearer disclosure of ageing, project commitments and expected deployment schedules.
Recommended Disclosure
| Disclosure | Why it matters |
| Ageing of unspent balances | Separates recent receipts from long-pending funds |
| Committed and uncommitted amounts | Shows how much is already tied to approved projects |
| Programme-wise deployment schedule | Connects cash holdings with delivery milestones |
| Interest earned and applied | Improves visibility over the full value of foreign funds |
| Outcome reporting | Links financial utilisation with beneficiary-level change |
5. Recipient Distribution and Compliance
The funding-band data shows a highly varied recipient base. Between 2022 and 2024, one NGO received more than Rs.500 crore; 14 received between Rs.100 crore and Rs.500 crore; 294 received between Rs.10 crore and Rs.50 crore; and 4,508 organisations received between Rs.5 lakh and Rs.50 lakh.
| Funding band | Number of NGOs | Analytical reading |
| Above Rs.500 crore | 1 | Exceptional large recipient |
| Rs.100 crore to Rs.500 crore | 14 | Very large institutions |
| Rs.10 crore to Rs.50 crore | 294 | Large programme portfolios |
| Rs.5 lakh to Rs.50 lakh | 4,508 | Broad small-recipient segment |
Cancellation Profile
The government has cancelled 21,983 FCRA registrations. Of the reported cancellations, 91.3% were attributed to failure to file annual returns, 7.9% to inactivity and 0.4% to legal violations. Applied to the stated total, these percentages correspond approximately to 20,069, 1,737 and 88 cancellations. Percentages do not account for the complete total because of rounding or residual categories.
| Reported reason | Share | Approximate count |
| Annual returns not filed | 91.3% | 20,069 |
| Inactivity | 7.9% | 1,737 |
| Legal violations | 0.4% | 88 |
| Residual or rounding | 0.4% | 89 |
Approximate counts are calculated from the reported total and are not official category counts. The dominant role of non-filing shows that basic compliance capacity is a decisive institutional risk. Boards should treat FCRA reporting as a continuous governance function rather than a year-end documentation exercise.
6. Regulatory Framework
The Ministry of Home Affairs states that the FCRA, 2010 regulates the receipt and utilisation of foreign contribution and seeks to prevent diversion towards activities detrimental to national interest. Associations seeking funds for definite cultural, economic, educational, religious or social programmes may obtain registration or prior permission, subject to prescribed scrutiny.
Applications Disposed Between April and December 2024
| Service | Applications disposed |
| Registration | 1,242 |
| Prior permission | 187 |
| Renewal | 1,643 |
| Foreign hospitality | 5,464 |
| Change of details | 4,592 |
Core Compliance Architecture
| Requirement or change | MHA description |
| Transfer restriction | Foreign contribution cannot be transferred from one association to another |
| Administrative-expense ceiling | Reduced from 50% to 20% of contribution received in a financial year |
| Identity requirement | Aadhaar mandated for office bearers |
| Renewal scrutiny | Field inquiry to assess whether on-ground activities are carried out |
| Banking route | Foreign contribution may be remitted only into the FCRA account at SBI New Delhi Main Branch |
| Asset reporting | 2023 rules sought details of fixed and movable assets created from foreign contribution |
7. Recent Changes and Strategic Priorities
The MHA Annual Report records that the Foreign Contribution Regulation Rules were amended on 31 December 2024. Associations may carry forward the unutilised portion of the 20% administrative-expense limit to the immediately succeeding financial year. Chartered accountants certifying annual returns must also certify FCRA violations and provide relevant details. The rules and Form FC-4 were adjusted to address the FCRA portion of income-tax refunds.
A public notice dated 21 January 2025 stated that receipt or utilisation of foreign contribution without a valid registration is a violation. Transactions in FCRA or utilisation accounts after a certificate is cancelled, ceases or expires may attract penal action.
Priorities for NGOs
| Priority | Recommended action |
| Board oversight | Review FCRA receipts, deployment and exceptions at every board meeting |
| Validity controls | Maintain alerts for registration and renewal deadlines |
| Return filing | Reconcile books, bank accounts and FC-4 disclosures before submission |
| Fund deployment | Prepare grant-wise utilisation and ageing schedules |
| Donor concentration | Monitor dependence by donor and country |
| Outcome evidence | Connect expenditure with outputs, outcomes and beneficiary feedback |
| Closure protocol | Stop prohibited transactions immediately if validity changes |
Priorities for Policymakers
Machine-readable, anonymised aggregate data would improve sector understanding. Useful additions would include median receipts, zero-receipt registrations, state-and-sector cross-tabs, ageing of unutilised balances, disposal timelines, reasons for rejection and outcome-oriented reporting. Predictable guidance and proportional enforcement can strengthen compliance without weakening legitimate social investment.
India CSR Assessment
The evidence points to a sector in consolidation. The next phase of FCRA governance should measure success not only through control of inflows, but through transparent, timely and demonstrable public benefit from every rupee received.
Methodology Limitations and Sources
Methodology
India CSR calculated percentage changes and shares from the figures contained in the supplied September 2026 news brief. Amounts are expressed in nominal rupees crore. Shares may not sum exactly because of rounding. No inflation adjustment was applied. Approximate cancellation counts were calculated by applying the reported percentages to the stated total.
Important Limitations
- The parliamentary dataset is partial. It lists active-association figures and funding values for selected states and source countries, not a complete national table.
- The descriptors religious, Christian, Hindu, Buddhist, Muslim and non-religious are reproduced only where supplied. The available brief does not explain whether these categories are mutually exclusive or how they relate to the Rs.5,150 crore aggregate, so no additional share calculations have been made.
- The attached MHA Annual Report 2024-25 covers administrative developments and application disposal through 31 December 2024. It is not the source of the later Rs.22,974 crore JPC figure.
- Organisation-level data, medians, project periods and ageing schedules were unavailable. Aggregate averages are therefore not presented as typical NGO receipts.
Primary and Reporting Sources
- Ministry of Home Affairs, Government of India, Annual Report 2024-25, Chapter 12, paragraphs 12.33 to 12.49, pages 266 to 268.
- Figures presented by MHA officials to the Joint Parliamentary Committee examining proposed FCRA amendments, as reproduced in the reporting brief supplied to India CSR on 18 September 2026.
About India CSR
India CSR is an independent platform covering corporate social responsibility, sustainability, ESG, philanthropy and social impact in India. Its research and editorial work aims to make development finance, governance and impact evidence accessible to institutions and the public. Source base Ministry of Home Affairs Annual Report 2024 25 and figures presented to the Joint Parliamentary Committee in September 2026 as supplied in the reporting brief
© 2026 India CSR. Prepared for editorial and research use.
Also Read
Centre Defends FCRA Bill as National Security Measure; Opposition Raises Concerns
FCRA-Registered NGOs Fall 50%, Foreign Funding Rises to ₹22,974 Crore